Measure, Crunch and Benchmark: Helping organizations advance business and social performance goals
As microfinance practitioners who constantly search for data to support decision-making, we sometimes find ourselves with only half the picture. To put it in simpler terms, sometimes we know how organizations are performing but don’t have any data to benchmark against it. Or many times we have good secondary data to understand the context, but don’t have primary data from the organization so no benchmarking is possible.
There is an increasing need for robust analysis and data to support decision-making in development in general, and in microfinance in particular. Benchmarking enables organizations not only to better understand and compare how they are performing, but also gives them the chance to adjust their business and social strategy accordingly. At Grameen Foundation, we are using a mix of primary and secondary data to support decision-making in MFIs and pro-poor organizations across different regions. To illustrate this, we wanted to share an example of how we are helping an MFI better allocate its resources to increase its poverty outreach. This approach also gives the MFI a better understanding of how customers at different poverty levels are contributing to the “bottom line” of the business.
Poverty outreach benchmarking
To make this poverty benchmarking possible, we used the Progress out of Poverty Index® along with public secondary data from national statistical offices.
Once the PPI survey was collected from the customers, the data was aggregated at a region, provincial or departmental level, and compared against the national poverty rates in those same locations. Graph 1 shows the MFI’s poverty outreach against national rates in those same locations. The result was a graphical representation of the regions where the organization is underperforming against the provincial poverty rate (in the red shaded area).
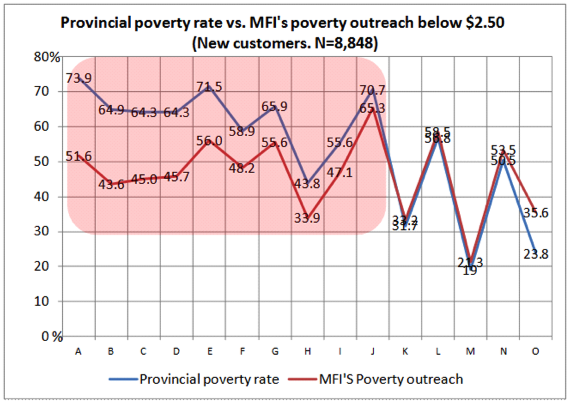
With this kind of information, organizations can redirect resources to specific locations, and plan ahead against their social performance targets.
Benchmarking against your own segments
Many of us know the “Pareto principle” that says 80 percent of the outcomes are caused by only 20 percent of the agents. In this MFI, that principle does not apply.
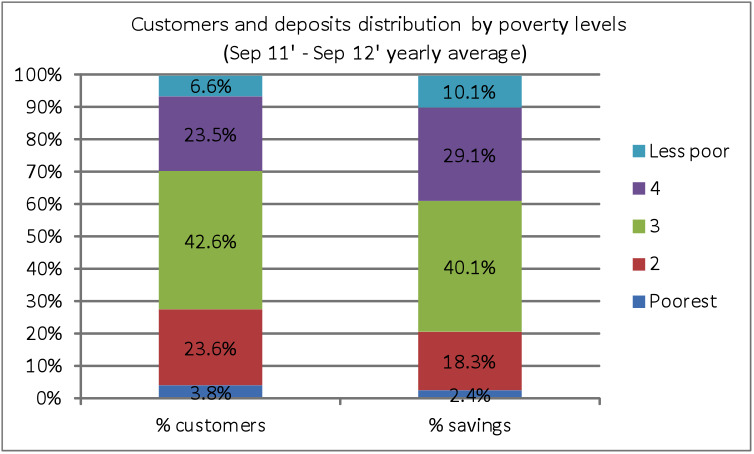
The following two graphs display the percentage of customers with savings and those taking loans based on different poverty levels (data from Sep 2011 to Sep 2012).
In terms of savings, the less-poor customers (top two segments) – who represent 30 percent of the savings client base – contribute only 39 percent of the balances. When looking at the credit business, things look similar: the less-poor customers (30 percent) are responsible for 41.
Savings
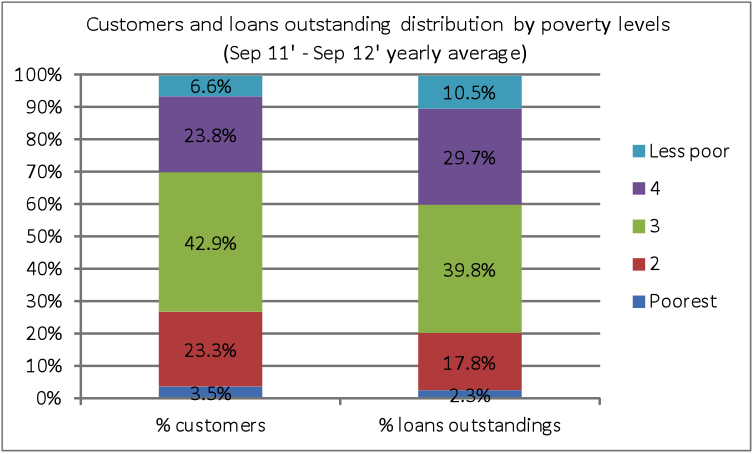
Loans
Having this kind of insight immediately ignite business questions like: Why are the less-poor customers not saving more money with this institution? Why are we not seeing the top segments overtaking (in volume and outstanding) the poorer segments, especially when the risk factor associated with this MFI, and the country as a whole, is very low, and the interest rates offered are competitive?
Opportunities
Benchmarking your performance against your own segments, against competitors, or against a national number, statistic or figure is a great way to drive decisions and strategy. In this case, any effort to increase savings volume and loans among the less-poor segments would benefit the business as a whole. It also would facilitate cross-subsidization of products and services to the poorest segments, and redirect resources to increase poverty outreach.
Jacobo Menajovsky is the senior data analyst at Grameen Foundation.
- Categories
- Impact Assessment
- Tags
- microfinance
